In this post
A dashboard cannot clarify the control question retrospectively
Measurability begins with a business question and an intended decision. Only then are the goal, hypothesis, metric, event, data source, quality rule, and responsibility defined.
Reporting is the end of this preparation, not its substitute. If the measurement concept is missing, a report primarily visualizes the system's lack of clarity.
Starting point
Many companies start their measurement work with the tool. An analytics solution is set up, a tag management system is added, and a dashboard is built. Subsequently, page views, sessions, clicks, campaigns, form events, and costs are displayed side by side.
The interface looks professional. Nevertheless, fundamental questions arise during the meeting:
- Which of these key figures actually describes business impact?
- Is a form call already progress or just a technical interaction?
- Was an event recorded the same way on all sides?
- Are internal accesses, test data, and duplicate triggers excluded?
- What decision should follow from a change?
- Who checks whether the data still matches the current website and the real process?
These questions are not a reporting problem. They show that no common measurement logic was established before data collection.
In October 2021, this difference was particularly relevant. The number of digital touchpoints increased, campaigns and websites were instrumented in more detail, and Google had introduced a more event-based measurement model with the new generation of Analytics. This opened up more flexible data collection. However, it did not automatically answer which events were meaningful for a specific company.
More measurable interactions therefore did not necessarily lead to better control. Without a connection to goals, the additional depth of detail could even increase the number of key figures without improving decision-making.
What lies behind the problem
Available data is confused with relevant data
Tools provide standard metrics. These are technically easily available and therefore quickly included in reports. However, their availability says nothing about whether they answer a business question.
Page views can be important for the use of a knowledge base. For the quality of a complex B2B inquiry, they are only an indirect signal. A high click-through rate can indicate relevance. It can also arise from a misunderstanding of expectations.
Relevance does not arise from the KPI itself. It arises from the context between the goal, user behavior, and the intended decision.
Key figure, KPI, and goal are mixed up
A metric describes an observed value. A KPI is a selected metric used to assess an important goal or process. A goal describes the desired state or intended change.
Whoever declares every available value as a KPI loses priority. Whoever formulates a goal only as a number, without naming the underlying effect, also creates ambiguity.
„More conversions“ is not yet a sufficient goal. It must be clarified which action counts as a conversion, what quality it should have, and what business result it serves.
Events are defined technically rather than functionally
An event is initially an observable action or system state. Technically, a click, a form start, or a download can be recorded. In terms of content, it must also be clarified what this event means.
A download can show interest. It does not prove purchase intent. A form submission can represent an inquiry. It says nothing yet about its suitability or the subsequent sales process.
The technical recording must therefore be based on an event definition that describes the name, trigger, significance, conditions, exclusions, and expected consequence.
Data quality remains without responsibility
Measurement errors do not only arise from defective tags. They also arise from changed forms, new campaign parameters, duplicate triggers, inconsistent naming, missing exclusions, and subsequent changes to processes.
Without accountability, data quality is only checked when results appear implausible. Then it is often no longer clearly reconstructible when the deviation occurred.
Data quality is therefore not a one-time technical test. It is a recurring task of checking, documenting, and correcting.
Reports are created without preparing decisions
A regular report can create transparency. However, it does not automatically become a steering instrument.
This requires prior clarification:
- What change is relevant?
- At what deviation is it checked?
- Which causes are investigated first?
- Which person is allowed to adjust measures?
- When is an observation not yet a reliable trend?
- What additional information is needed?
Without these rules, the report remains descriptive. It explains what is displayed, but not what should follow from it.
Strategic Classification
A robust measurement concept connects seven levels:
- Business question: What does the company need to know?
- Decision: Which action should improve through the insight?
- Goal and hypothesis: What change is expected and why?
- Metrics and events: Which observable signals are suitable for this?
- Data sources and quality: Where does the data come from and how is it checked?
- Interpretation: In what period, segment, and comparison framework are values read?
- Measure and learn: Which adjustment follows and how is its effect re-examined?
This order does not prevent existing data from being used. It merely assigns them to a functional role.
The British service methodology formulated a similar principle even before 2021: Metrics should be derived from the purpose, benefit, and hypotheses of a service. Only then are data sources, analysis, and presentation determined. Dashboards and reports deliberately appear late in the chain.
Even the event-based model of the new Google Analytics generation introduced in 2020 did not change this responsibility. It made interactions more flexibly describable. The meaning of the events still had to be defined by the company.
The measurement chain
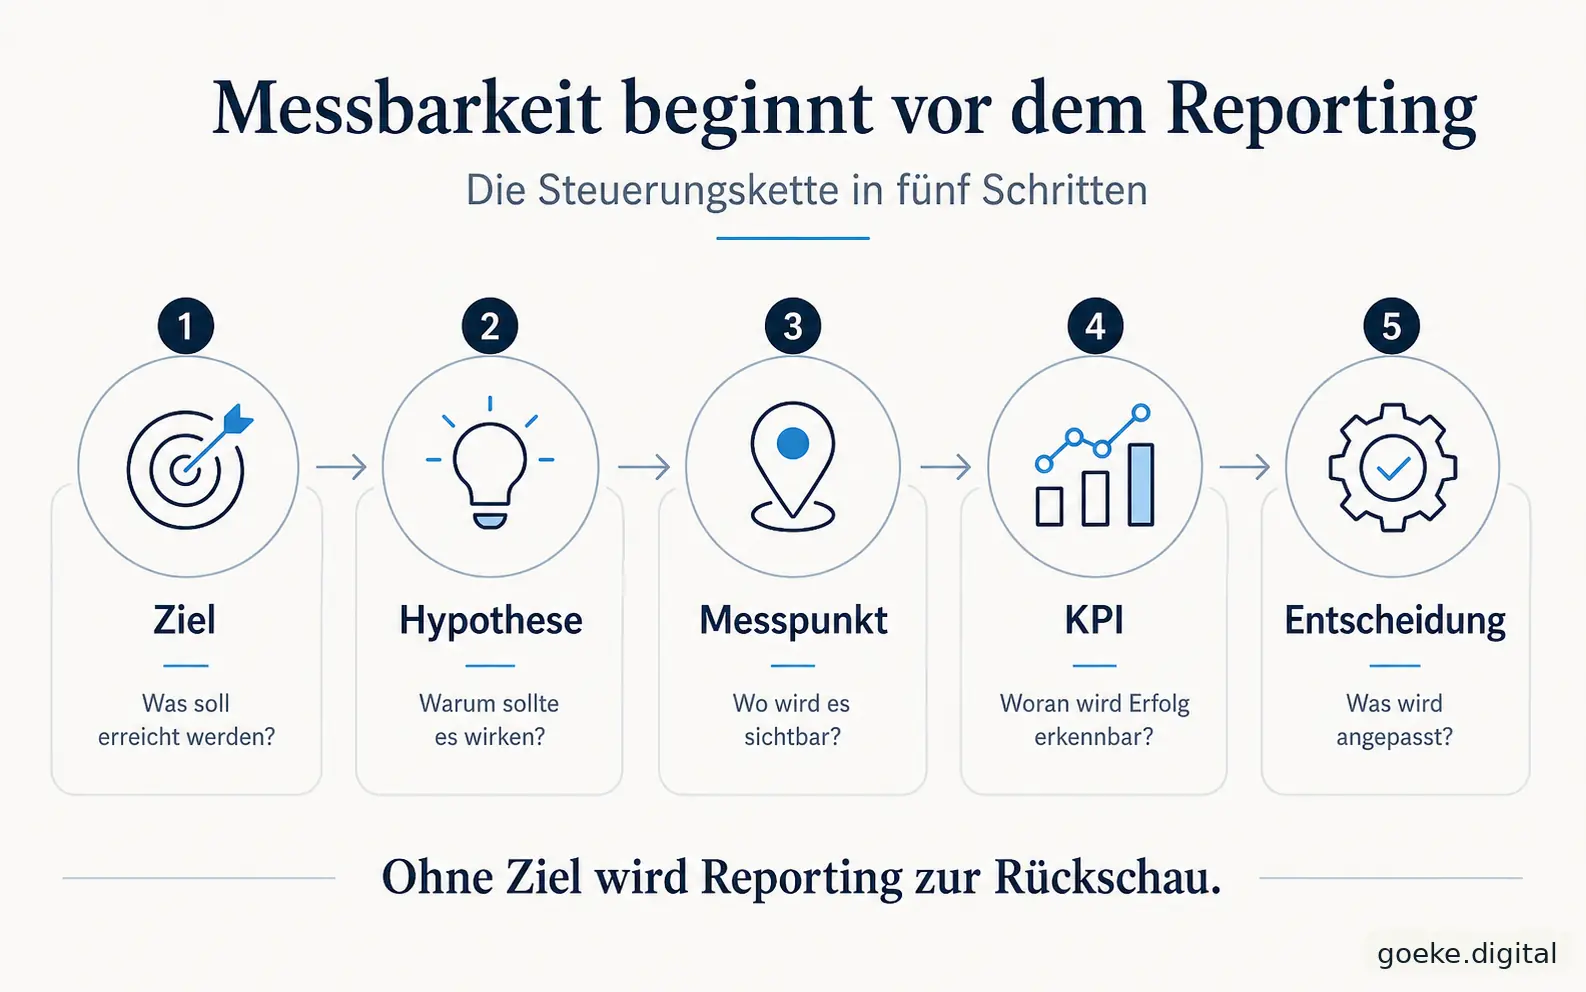
Data quality must be sufficient for the purpose
Perfect data is rarely achievable in real digital systems. However, this does not mean that every deviation is acceptable.
The necessary quality depends on the decision. For a rough observation of interest in a topic area, stable trend measurement may be sufficient. Higher requirements are necessary for budget shifts, sales forecasts, or the evaluation of individual campaigns.
At least five quality questions should be answered:
Completeness
Are the relevant events captured in all intended situations, or are devices, pages, process steps, or channels missing?
Correctness
Does the recorded event correspond to the actual action, or do double counts, test data, and false triggers arise?
Consistency
Are terms, parameters, time periods, and definitions used consistently across systems and reports?
Timeliness
Are the data available in time for the intended decision, and is it known what delays exist?
Context
Are segment, comparison period, baseline, seasonal effects, and process changes documented?
ISO 8000 already classified data quality as a management task before 2021. The crucial point for digital measurement systems is not the certification itself. What is relevant is the organizational consequence: quality requires processes, roles, and repeatable testing.
Data protection belongs in the measurement concept
A measurement concept must not only clarify what can be technically captured. It must also justify which data are required for the defined purpose.
The General Data Protection Regulation names purpose limitation, data minimization, and accuracy as principles, among others. For practical measurement planning, this means:
- do not collect every possible piece of information as a precaution,
- process personal or person-related data only on a clarified basis,
- Limit storage and access,
- Document measurement purposes clearly,
- Involve legal and technical review early on.
This contribution does not replace legal advice. For specific questions regarding admissibility, consent, or technical implementation, a specialized law firm or a data protection officer should be involved.
Data protection is not the opposite of measurability. A clear definition of purpose improves both. It limits unnecessary data collection and at the same time increases the professional significance of the remaining data.
Perspective from practice
In established systems, improvement rarely starts with a completely new dashboard. An inventory of the decisions that should be made regularly is more sensible.
This allows for backward checking:
- What questions are actually asked today?
- Which key figures are used for this?
- What definitions are behind this?
- What events and data sources feed these values?
- What checks are performed?
- Where do manual corrections or doubts arise?
- Which key figures are reported but never used for a decision?
It often turns out that a few measured variables have high control relevance, while many other values are merely observational material. This distinction does not devalue the additional data. It merely prevents a report from treating every number with the same significance.
Equally important is the connection between digital behavior and downstream processes. A website request only becomes commercially understandable if it is known whether it was relevant, processed, and what result it led to. For this, marketing, sales, and, if necessary, service must use common definitions.
Framework of action
1. Name the decision to be improved
Do not start by asking what metrics are available. Describe what recurring decision is to be better prepared for.
2. Separate goal and expected impact
Formulate the desired business state. Then add the assumption of how a specific measure should contribute to it.
3. Select few control-relevant KPIs
Only select key figures as KPIs that are essential for the goal and support a decision. Other key figures remain diagnostic or context values.
4. Document events and definitions
For each relevant event, define triggers, significance, parameters, exclusions, data source, and responsible person. Use consistent names across systems.
5. Define quality rules before regular operation
Determine check intervals, test cases, plausibility limits, and how to handle changes. Document known gaps instead of creating false precision.
6. Supplement reports with decision rules
Define which deviations trigger a check, which segments are considered, and who can decide on measures. A report should not only show values but also their meaning in the respective context.
7. Organize learning as a closed loop
After implementing a measure, don't just check the target value. Also evaluate whether the hypothesis, measurement, and data quality were sound. Adjust the measurement concept if the process, website, or business model changes.
What companies should not do
Companies should not build an extensive measurement architecture just because a tool can capture many events.
You should no more label every positive interaction as a conversion, select metrics to fit a result retrospectively, or compare historical values when definitions and recording have changed.
A dashboard may not claim accuracy that its data sources do not possess. Attribution should not be treated as complete proof of cause and effect. And a monthly report should not be continued if its recipients derive neither decisions nor audit mandates from it.
Consequences for companies
Measurability does not arise from the largest possible number of figures. It arises from a reliable connection between goal, behavior, data, and decision.
A good measurement concept does not necessarily reduce the data basis. It organizes it:
- few KPIs for control,
- supplementary key figures for diagnosis and context,
- defined events for observable actions,
- documented quality rules,
- clear responsibilities,
- recurring learning and adaptation loops.
How customers switch between research, proof of purchase, and personal contact shows „Customer decisions rarely follow a straight funnel“. Why measurement only works as part of a connected system, deepened "From individual measures to the digital impact system". The later annual evaluation “What digital maturity actually showed in 2025” places controllability within the larger organizational context.
The overall overview is provided by the Data and control subject areas.
Subject-matter connection
Check measurement concept, data basis, and decision logic together
A KPI and steering system begins with business questions, not with selecting a dashboard. In a structured discovery, goals, events, data sources, quality gaps, and responsibilities can be linked to a robust measurement architecture.
Clearly structure the measurement concept and digital data basis
Sources and technical foundations (7)
- Government Digital Service, 'How to set performance metrics for your service', 2017. Open source
- Government Digital Service, “Measuring the success of your service”, 2018. Open source
- Government Digital Service, „Define what success looks like and publish performance data“, 2019. Open source
- Google, “The new Google Analytics will give you the essential insights you need to be ready for what’s next”, 2020. Open source
- Google, „A new way to unify app and website measurement in Google Analytics“, 2019. Open source
- ISO, „ISO/TS 8000-60:2017. Data quality management: Overview“, 2017. Open source
- European Union, „Regulation (EU) 2016/679“, particularly Article 5, 2016. Open source